Qwen3.8-Max is 39 points behind Claude Opus 5 at turning images into code
A 39-point gap on an Elo-style board is close. What makes the result interesting is that this benchmark is unusually hard to game.
Published
July 30, 2026
Reading time
2 minutes
Perspective
Analysis
Topics
multimodal · qwen · coding
Arena.ai reports Qwen3.8-Max at #2 in the Image-to-WebDev Arena with 1,631 points, trailing Claude Opus 5 (Max) by 39 points.
On an Elo-style scale that is a narrow gap — meaningful, but not the difference between working and not working.
Why this benchmark resists gaming
Most multimodal evaluation asks a model to describe an image and scores the description against a reference, with a human or judge model deciding. Both are noisy, and both reward fluency independently of accuracy.
Image-to-code closes the loop. The output renders or it does not; the render matches the input or it does not. You can diff it.
That makes it one of the few multimodal benchmarks where the grader is closer to a compiler than an opinion — which is why a 39-point gap here carries more information than a larger gap on a judged benchmark.
What the task actually requires
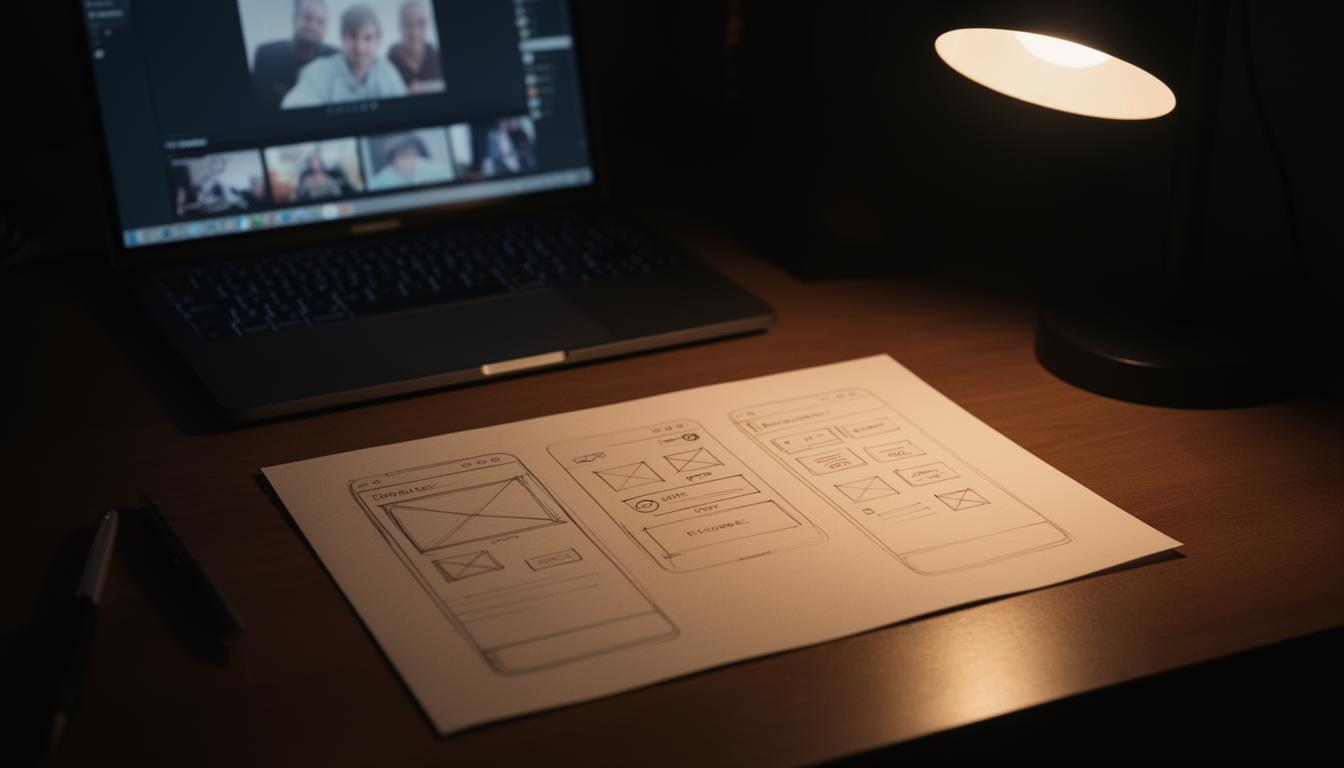
Three things jointly: reading a layout from pixels, inferring the intent behind it (this is a nav bar, this is a card grid), and emitting code that reproduces it.
The middle step is the hard one. Pixel-perfect reproduction without structural understanding gives you absolutely-positioned divs that break at any other viewport. Structure is where models differ.
Where this points beyond web development
The same capability reads a figure in a paper.
A large share of what a paper actually claims lives in its figures — the ablation showing which component matters, the curve revealing where a method fails, the diagram explaining the pipeline. Text-only retrieval discards all of it. Every embedding-based literature tool is effectively reading the caption and hoping.
A model that converts a rendered layout into structure is doing the same operation on a different input.
The honest limitation
Reading values off a chart introduces error, and a model that fluently hallucinates a plausible number is worse than one that declines. For anything load-bearing you still need the underlying data.
And arena conditions are clean inputs. Photographs of screens at an angle, in poor light, with something in frame — that is what real input looks like, and it is not what is being scored.
The nearer-term use
Internal tooling, not literature review: a whiteboard photo into a diagram, a screenshot of a broken UI into a bug report, a slide into an editable layout. Lower stakes, and errors that are obvious rather than silent.
Source: @arena via @Alibaba_Qwen
Continue reading